Control loop measurements help to characterize how your power supply responds to changes in demand. You need your supply to respond quickly, but without excessive ringing or oscillation. By measuring the actual gain and phase of your circuit over a range of frequencies, you can gain confidence in the stability of your design – greater than relying on simulation alone. Using an oscilloscope, signal source and automation software, measurements can be made quickly and presented as familiar Bode plots, making it easy to evaluate margins and compare circuit performance to models.
Oscilloscope-based response measurement setup
For power supply designs, closed loop response measurements should be made from near DC to a few MHz.
While vector network analyzers are often used for response analysis, most VNAs are designed for RF
measurements with starting frequencies around a megahertz. In contrast, oscilloscopes can measure down to
DC and provide useful signal visibility. If anomalies turn up during your analysis, you can quickly jump into
troubleshooting.
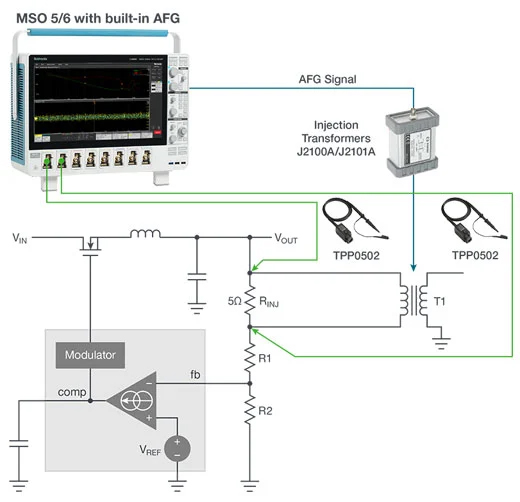
Several Tektronix oscilloscopes offer built-in signal sources that may be used to inject a signal into the loop’s
feedback through an isolation transformer. Two probes, applied across a low-value injection resistor, provide all
the information the analysis software needs. It measures the stimulus and response amplitudes to calculate
gain, and measures the phase delay between stimulus and response.
The general system for automated control loop response consists of:
- An oscilloscope with appropriate bandwidth
- Power supply frequency response
automation software
- Two low-attenuation, low-capacitance probes
- A sinewave generator
- A transformer with flat response to isolate the sinewave generator from the DUT
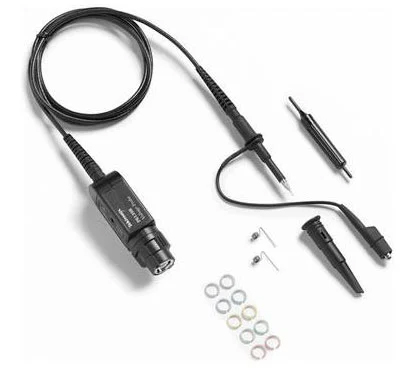
Probe characteristics for control
loop measurements
To avoid overdriving the control loop, the injection signal's amplitude must be kept low.
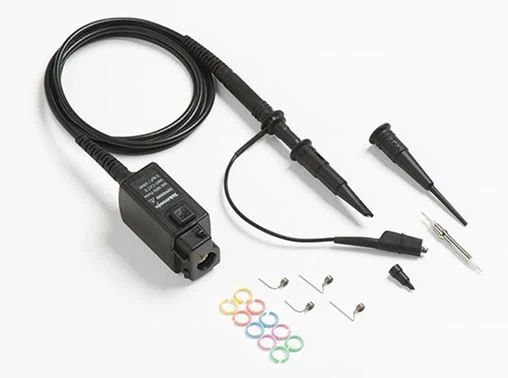
Probe attenuation should be minimized to get the best sensitivity. At the same time,
probe loading effects should be minimized. Durable, low-attenuation, low capacitance
passive probes such as the TPP0502 are well-suited for these measurements with 2X
attenuation, and 2 MΩ, 13 pF loading.
Fast demand changes introduce high frequencies into power supply control loops. Supplies
must respond quickly but adding too much gain will cause ringing or oscillation.
Instability occurs when the loop has positive gain (≥ 1) as phase shift approaches -180°.
Under these conditions the loop will experience positive feedback and become unstable.
Bode plots show gain and phase on the same frequency scale and let you see how close
you are to this undesirable situation.Two measurements taken from a Bode plot gauge the
safety margin in the control loop: phase margin and gain margin.
Phase margin indicates how far the system is from instability (-180° and unity gain) in terms
of degrees of phase. It represents the amount of phase shift the loop can tolerate
as the gain approaches 0 dB (unity gain).
Gain margin is how far the system is from -180° and unity gain in terms of dB of gain. This is
the amount of gain that could be added before hitting 0 dB, when phase shift = -180°.
Maintaining ample phase and gain margin in the control loop ensures that a power supply
will not operate too close to instability.
An oscilloscope-based system provides more versatility than dedicated network analyzers. A system includes:
An oscilloscope with frequency response analysis software
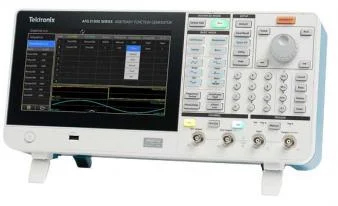
A function generator
Probes and cables
Injection transformer for Bode plots
Line injector for PSRR measurements
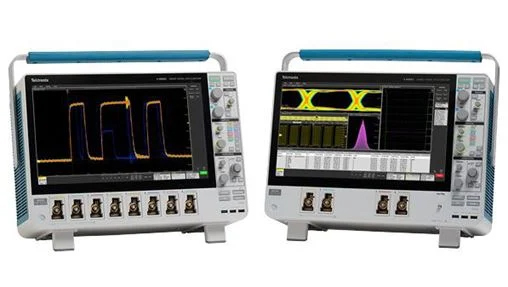
The 4, 5 and 6 Series MSO oscilloscopes offer an Advanced Power Analysis option (PWR) and an optional
built-in function generator. Picotest injection transformers (J2100A or J2101A) and line injectors (J2120A)
are recommended for Bode plots and PSRR measurements.
Advanced power measurement and analysis
Pre-compliance at a fraction of the cost
Cutting test time in half
With innovative pinch-swipe-zoom touchscreen user interfaces, 12-bit analog-to-digital converters, large high-definition displays, and up to 8 FlexChannel® inputs, the 4/5/6 Series MSOs are ready for today’s toughest challenges, and tomorrow’s too. It sets a new standard for performance, analysis, and overall user experience.
Passive voltage probes ship standard with most oscilloscopes and provide a low cost, general purpose probing solution. Generally, these probes lack the performance of an active voltage probe but provide the ruggedness and wide dynamic range suitable for visualizing signals over a broad range of applications. X
The AFG31000 series with InstaView™ technology is the first high-performance AFG with built-in waveform generation applications, patented real-time wave monitoring, and a modern user interface. x
X
X
 KALİBRASYON LABORATUVARI
 Probe characteristics for control
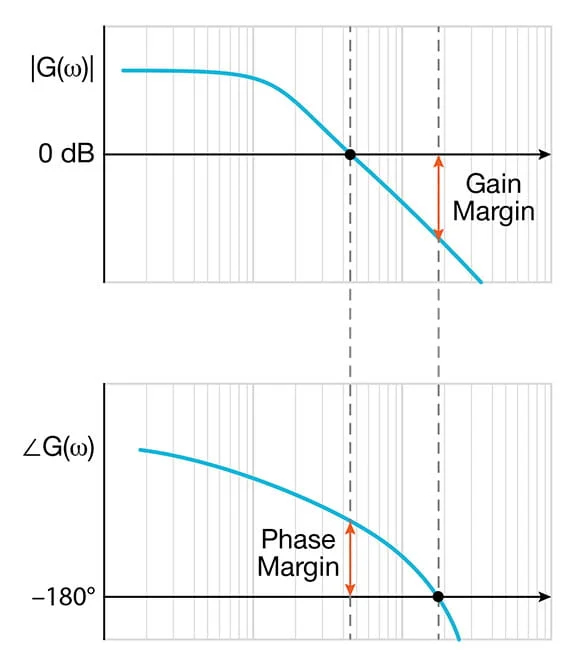 Fast demand changes introduce high frequencies into power supply control loops. Supplies
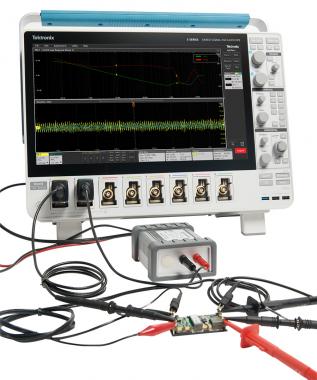 Control loop analysis system