Measurements on Three-Phase Variable Frequency Drives
Measurements on Three-Phase Variable Frequency Drives
Measurements and analysis on three-phase power systems are inherently more complex than on single-phase systems. Power converters based on Pulse Width Modulation (PWM), such as variable-frequency motor drives, further complicate measurements since filtering and triggering on PWM signals are challenging.
During debug and validation phases, oscilloscopes are the instrument of choice thanks to their versatility and speed. They can precisely measure the performance of switching power converters and control circuitry. With the right probes, they can measure with high bandwidth over wide ranges.
Special 3-phase inverter motor drive analysis software enables fast, repeatable analysis.
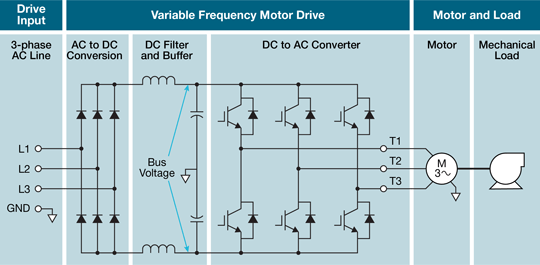
Operation of a Variable Frequency Drive (VFD)
A typical motor drive system is driven by a three-phase AC input
which is fed to a drive section or power converter section.
The drive section has three main blocks:
A rectifier which converts AC-DC
A DC bus
A DC to AC inverter that converts the DC voltage into an AC signal
(in most cases, a PWM waveform).
Although it’s not shown in this diagram, feedback loops and control logic
monitor the motor load and adjust the drive system to control torque and
speed. This enables the system to drive the motor under conditions ranging
from no load to maximum load.
In the lab, power quality measurements are used to understand the way in
which equipment consumes energy supplied by the three-phase AC line.
For each phase, power quality measurements typically include:
-RMS and magnitude of voltage and current
-True power, reactive power, apparent power, phase angle, and power factor
-Frequency
In addition to numerical readouts of RMS voltage and current, phasor diagrams
(shown at the left) can provide a quick way to see voltage and current relationships.
Imbalances and phase shifts that impact power factor are immediately apparent.
Power factor is an important specification for any industrial equipment since it has
direct impact on end-customers’ utility bills. Some drives include active circuitry to
control power factor.
Harmonics can also impact the overall efficiency and even reliability of
the end-customers’ system. Because of this, harmonic distortion is often
subject to regulation. A harmonics bar-chart with IEEE-519 limits is
shown at the left. User-defined limits may be used for margin testing.
Ripple is defined as the residual or unwanted AC voltage on a constant DC
component. It is typically measured on the DC bus. This measurement helps
to understand how efficiently the signal is getting converted from AC-DC on the
input side and the impact of unwanted components on the PWM signal on the
output side.
A line ripple measurement gives the RMS value at the configured line frequency,
and peak to peak of the time domain waveform for the configured phases and
a Switching Ripple Measures RMS at the configured switching frequency, and
peak to peak of the time domain waveform for the configured phases.
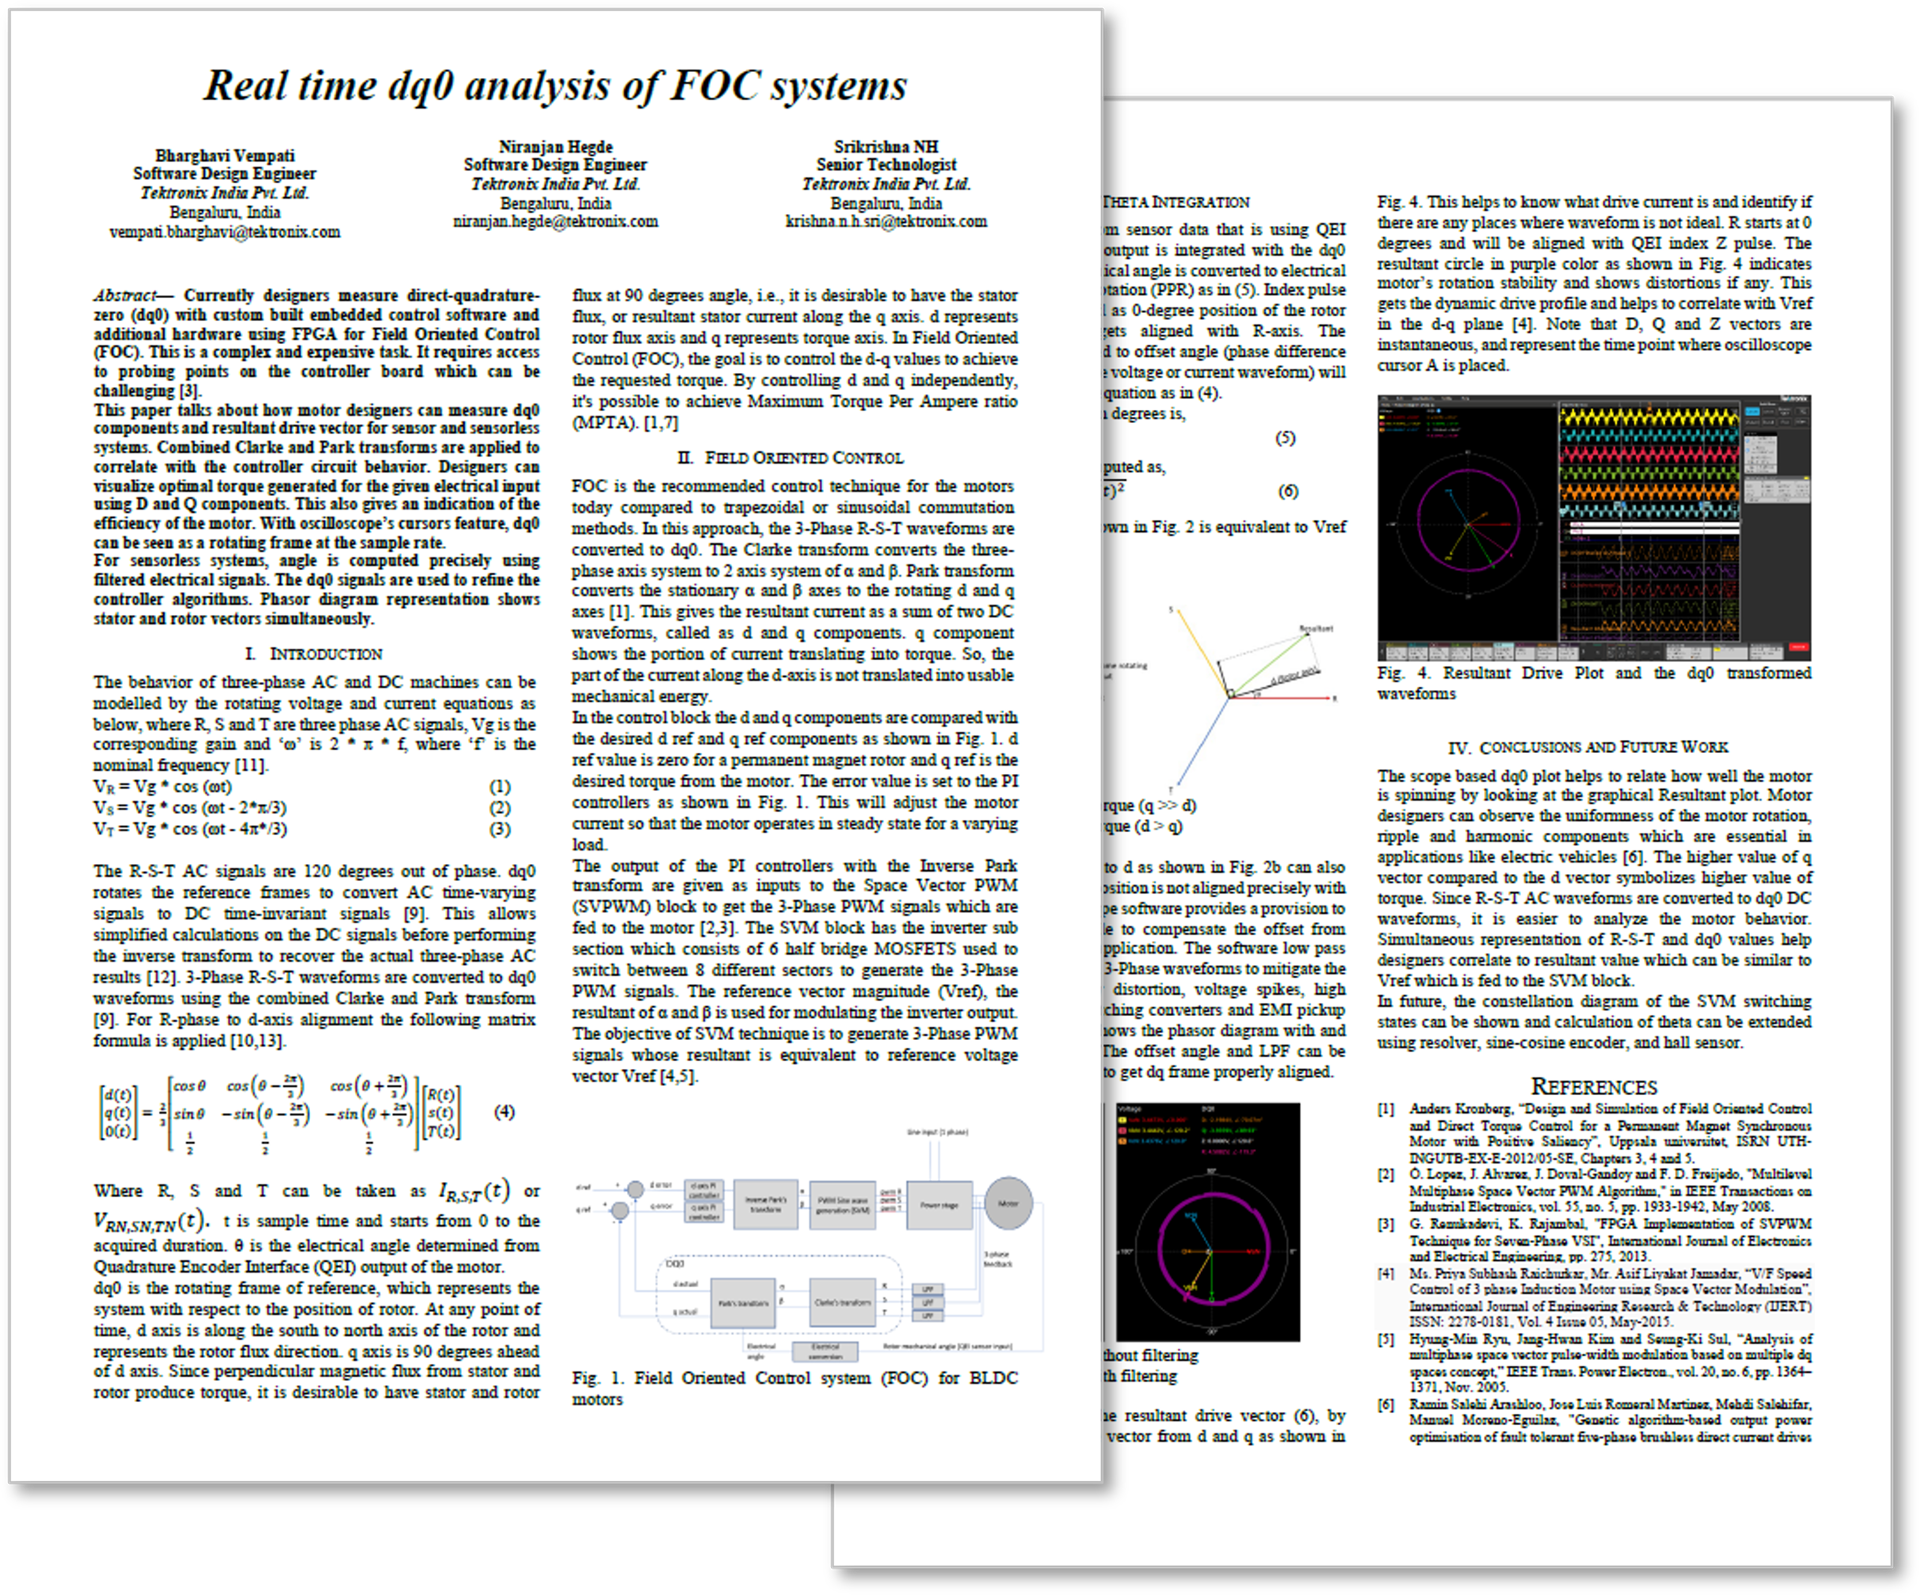
Direct Quadrature Zero (DQ0)
Vector control systems use Clarke and Park transforms to simplify three -phase
signals into D and Q control vectors. Being able to measure these vectors lets
you confirm that the control system is working as expected. Unfortunately,these
important variables are often calculated in real time, deep within the control
system, and are not brought out as external signals.
DQ0 measurements (Opt. IMDA-DQ0) on Tektronix 5/6 Series oscilloscopes use
signal processing to calculate and measure the D and Q vectors based on the
drive’s output signals, so you can compare actual versus expected performance.
Results are displayed as phasors, transformed waveforms, and scalar values.
The DQ0 results are displayed as phasors, transformed waveforms,
and scalar values.
Efficiency is one of the critical measurements of the motor drive
system as an indicator of the overall performance of the system.
Efficiency measures the ratio of output power to input power.
It computes and displays efficiency at each phase, and the total
efficiency (average) of the system. Efficiency measurements use
the 2V2I configuration (2-wattmeter method), on 8-channel
oscilloscopes.
Mechanical Analysis
The IMDA mechanical analysis group (Option IMDA-MECH) supports Hall, resolver and
quadrature encoder interface (QEI) sensors to track motor angle, speed, acceleration
and direction. Measurements are configured using a few straightforward settings.
Measurements may be made with passive or differential analog probes. Hall or QEI
sensors may also be measured with 8-channel TLP58 logic probes to save analog
channels for use on other signals.
Speed measurements can be plotted to show the motor start-up sequence or deceleration
over long records. Histogram plots provide insights into the jitter profile of the measured
speed.
IMDA-MECH supports two methods for real-time torque measurements – torque sensors
or load cells, and armature current. When using the armature current method, torque is
calculated by applying a constant to the RMS motor current. The mechanical power of
the system may be calculated and displayed using torque and speed values.
Electrical power can be determined on the input of the drive, using voltage and current
measurements. Using torque and speed measurements on the output of the drive, the
application can measure the ratio of mechanical output power to electrical input power,
thus measuring overall system efficiency.
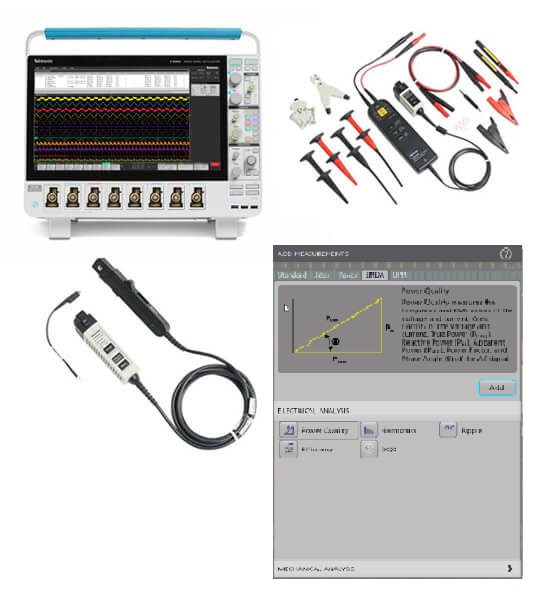
3-Phase VFD Troubleshooting and Characterization Reference System
An oscilloscope-based 3-phase test system enables system level measurements while observing VFD circuitry. High sample rates and long record lengths provide detailed views from Hz to GHz. There are many probe alternatives
for this application, but here’s an example of an excellent system:
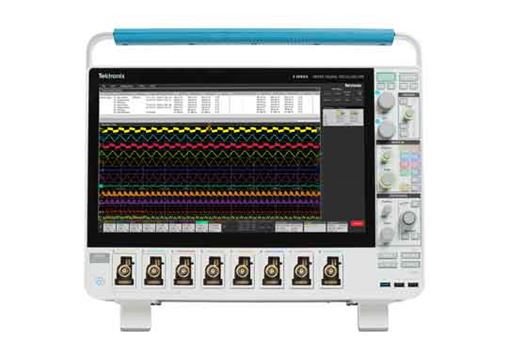
5 Series B MSO
Recommended for its 8 channels and 12-bit ADCs
Option IMDA
Automates 3-phase measurements on the 5 Series B MSO
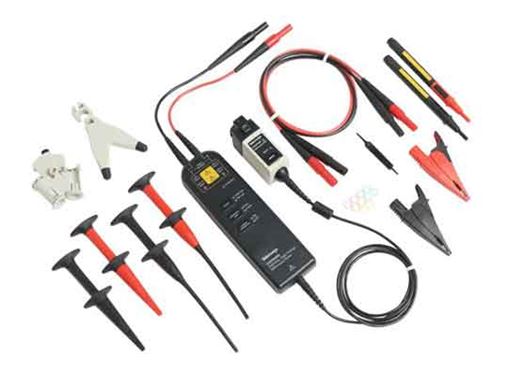
THDP0200 x 3
High voltage differential voltage probes. 100 MHz and up to 1500 V
5 Series B MSO
The 5 Series B MSO offers up to 8 inputs with a large HD display so you can see important details throughout your drive system.
Inverters, motors and drives analysis
The IMDA option takes care of all the calculations for 3-phase power measurements, including harmonics and efficiency.
 KALİBRASYON LABORATUVARI
 Operation of a Variable Frequency Drive (VFD)
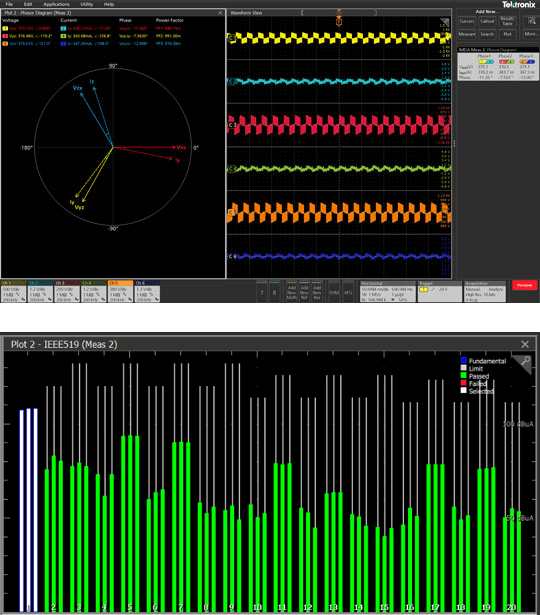 In the lab, power quality measurements are used to understand the way in
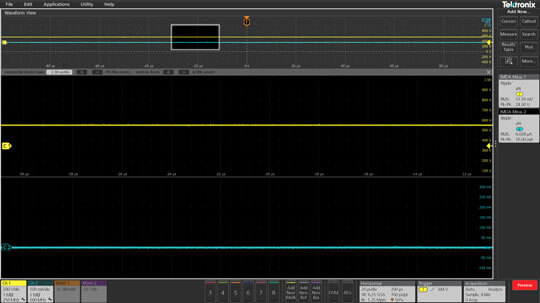 Ripple Analysis
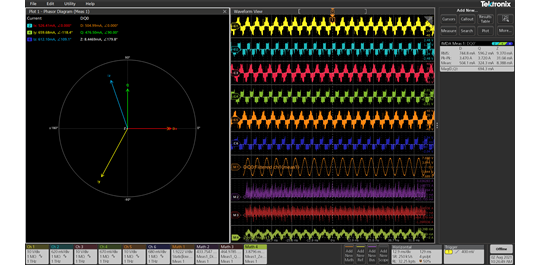 Direct Quadrature Zero (DQ0)
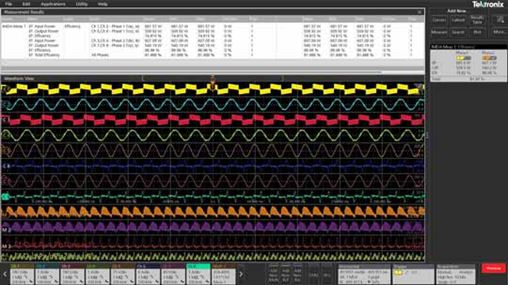 Drive Output Measurements
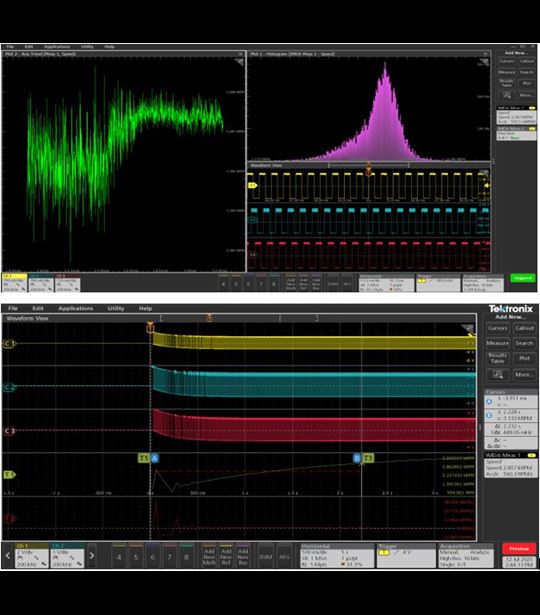
 3-Phase VFD Troubleshooting and Characterization Reference System